
Daily Internet Activity in 2025
How does your daily internet usage compare to the rest of the world’s?
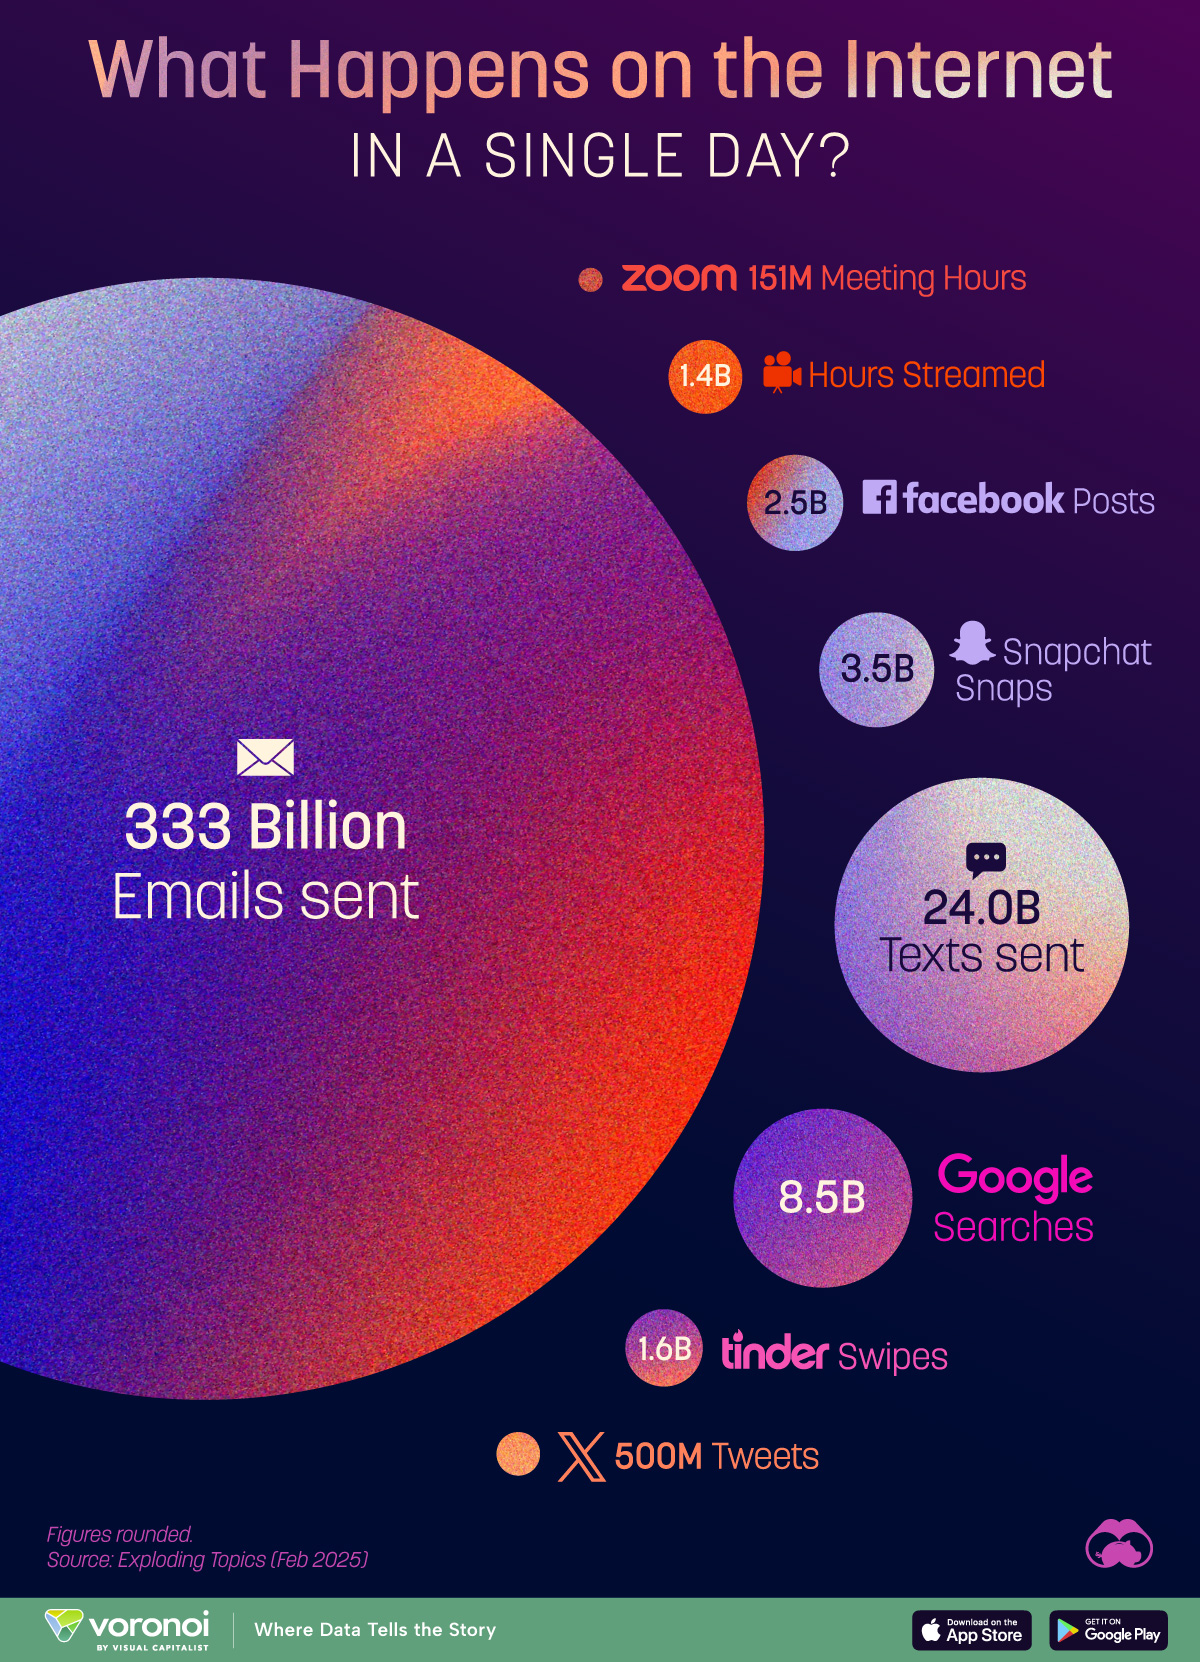
Visual Capitalist’s infographic breaks down the staggering amount of time we spend on the internet every day.
This is a great visual to show to students and engage them in conversation about their internet habits as the school year winds down and the summer starts.
Questions:
- Which of these statistics surprised you? Why?
- What other platforms would you want to see data for in this infographic?
- How much time do you spend on the internet on an average day?
- Which of these activities (e.g. sending emails, Google searches, etc.) do you do on an average day?
- What do you think these statistics will look like 5 years from now? 10? Explain.
Bonus question: The article states that “as of 2023, roughly 45.6% of global email volume is considered spam.” Does this change how you interpret the data? Explain.
Follow up this infographic with NGPF's lesson on Digital Citizenship!
Looking for more interactive resources? See more blog posts like this one.
About the Author
Sonia Dalal
Sonia has always been passionate about instruction and improving students' learning experiences. She's come a long way since her days as a first grader, when she would "teach" music and read to her very attentive stuffed animals after school. Since then, she has taught students as a K-12 tutor, worked in several EdTech startups in the Bay Area, and completed her Ed.M in Education from the Harvard Graduate School of Education. She is passionate about bringing the high quality personal finance content and instruction she wished she'd received in school to the next generation of students and educators. When she isn't crafting lesson guides or working with teachers, Sonia loves to spend her time singing, being outdoors, and adventuring with family and friends!
SEARCH FOR CONTENT
Subscribe to the blog
Join the more than 11,000 teachers who get the NGPF daily blog delivered to their inbox:
MOST POPULAR POSTS


